

Download free printable pictograph worksheets to help students learn how to read, interpret, and create picture graphs. These worksheets provide practice with picture graph keys, tally marks, data comparison, and drawing pictographs. Students can develop data-handling and graphing skills through activities designed for different ability levels.
Picture graph worksheets in this section teach children to represent data using pictures or symbols. This graphical representation is much easier as the numerical data collected is represented using pictures. Worksheets without key for beginners, with key for grade 2 through grade 6, reading, interpreting, and drawing pictographs are all given for practice.
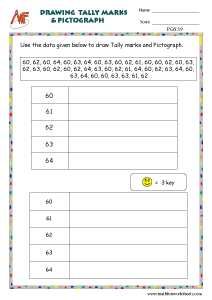
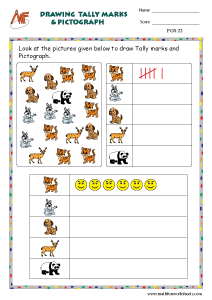
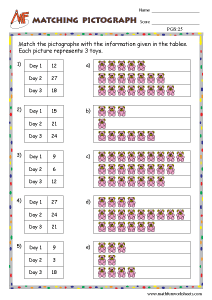
Also, worksheets to represent data using Tally marks and Pictographs and matching data to the given pictographs are here for best understanding of both these topics. You can download all these free pictograph worksheets for abundant practice.
Let us learn to represent the information on a picture graph
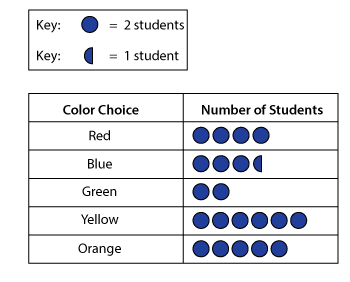
1. The first step is to collect data. Example : Collect this data from your class. Suggest your friends 5 colors and ask them their favorite color. Let’s consider 5 colors. Red, Blue, Green, Yellow and Orange.
2. Make a small table to record this information. With the given information, you can easily make a pictograph. Consider the key as 2. Select a simple picture for the pictograph.
3. 8 students like Red color. According to the key 2 students can be represented using a picture. How many 2’s are in 8?. It’s 8/2 = 4. Use 4 pictures.7 students like Blue color. Now divide 7 by 2. 7/2 = 3.5 or 3 1/2. So we will use 3 full pictures which represent 6 students and 1 half picture representing 1 student. Similarly you can represent pictures for Green, Yellow, and Orange.

Observations
Here we have prepared worksheets according to the Common core Standards. Worksheets can be used from grade 1 through grade 6.
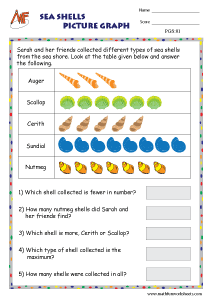
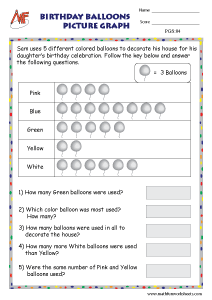
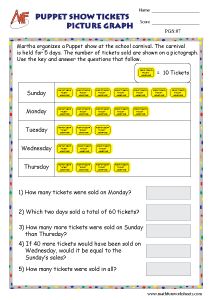
Build strong data-handling skills with our Tally Marks Worksheets, Bar Graph Worksheets, and Mean, Median, Mode, and Range Worksheets. Students can also explore Probability and Statistics Worksheets to practice analyzing and interpreting data. These related resources provide additional practice with charts, graphs, data collection, and statistics.
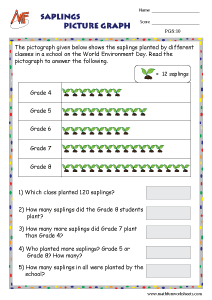
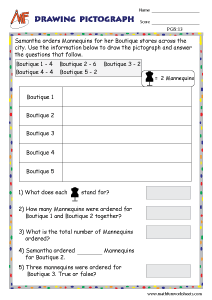
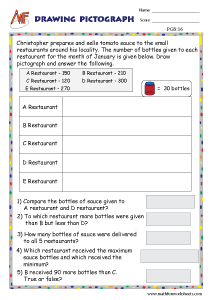
A pictograph is a graph that uses pictures or symbols to represent data.
Read the title, check the key, count the symbols, and use the information to answer questions.
Students practice reading, interpreting, comparing, and creating pictographs using different types of data.
The worksheets are designed for students from Grade 1 through Grade 6, with different levels of difficulty.
Yes. The worksheets are available as free printable resources for classroom and home practice.
Copyright © 2026 – Math Fun Worksheets