Search

Browse by Topics

Measures Of Central Tendency- Mean Median Mode Range Worksheets

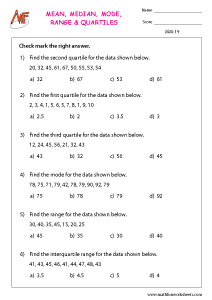
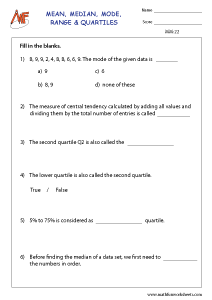
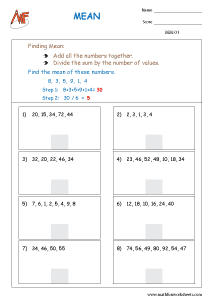
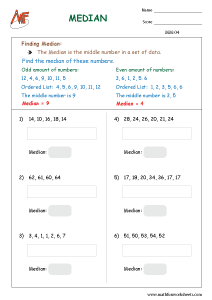
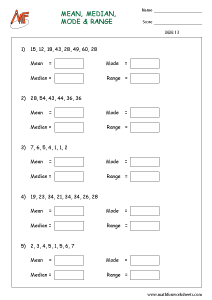
Download free printable mean, median, mode, and range worksheets to help students practice analyzing and interpreting data. These math worksheets provide practice calculating mean, finding the median and mode, determining the range, and working with quartiles. Students can develop essential statistics and data-handling skills through clear and engaging activities.

Let us discuss about each measure in detail:

1.Mean
The average value of a set of numbers is called the mean.
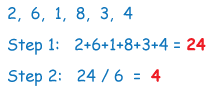
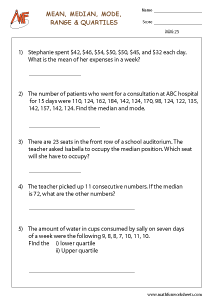
Mean, median, mode and range

Add all the numbers to get a total and then divide the total by the number of entries.

2. Median
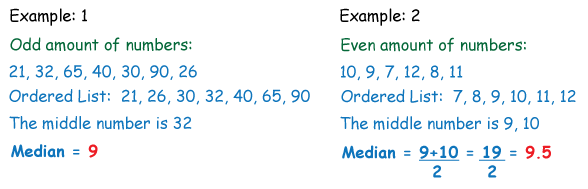
The middle number of a sorted data is called the median (ascending or descending data sample).

When the data sample has odd entries pick the middle value where half of the data lies below and above the middle value.

When the data sample has even amount of numbers, you have two median numbers. Here just add these numbers and divide them by 2.
 

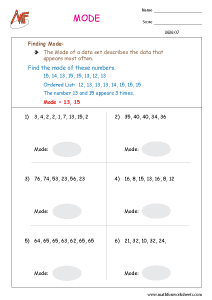
3. Mode
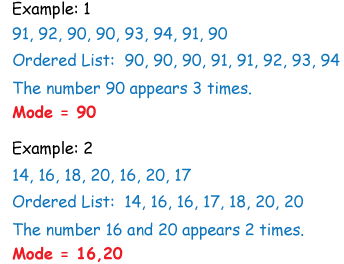
The data that appears more often in a data set is the mode. This measure can have more than one value for a set of data.
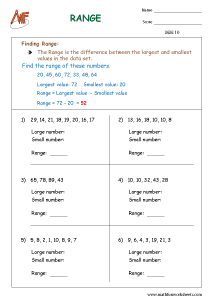
4. Range
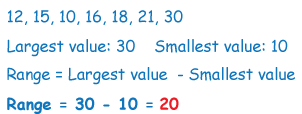
The difference between the highest and lowest values in a data set is called the range.
 

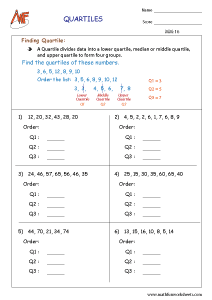
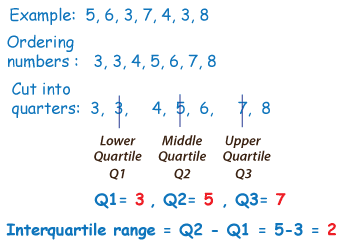
5.Quartiles
A quartile divides data into three points. They are lower quartile, median, and upper quartile to form four groups of the dataset. Lower quartile is also called as first quartile, second quartile as median and third quartile as upper quartile.

The distance between the first quartile and the second quartile is called the interquartile range.
Mean, Median, Mode and Range

Measures Of Central Tendency Worksheets

Teachers and parents love using these worksheets because they’re simple and effective. They support classroom lessons, homework, and review activities. Answer keys often come included, so checking work takes just a few minutes. As students progress, worksheets introduce larger data sets and mixed problems. This boosts their ability to analyze and compare different types of data. With each activity, students grow more confident and accurate.

Strengthen data-handling skills with our Tally Marks Worksheets, Bar Graph Worksheets, and Pictograph Worksheets. Students can also explore Probability and Statistics Worksheets to practice analyzing, interpreting, and organizing data. These related resources provide additional practice with graphs, statistics, and important data concepts.

In conclusion, this webpage provide clear, engaging practice for mastering key statistics skills. They turn complex concepts into simple steps. Add them to your learning routine, and help students become data-smart with ease.

Related Data Handling Worksheets

Frequently Asked Questions

Mean, median, mode, and range are statistics used to describe and analyze a set of data.

Add all the values in the data set and divide the total by the number of values.

Arrange the numbers from least to greatest and identify the middle value.

The range is found by subtracting the smallest value from the largest value.

These worksheets help students calculate and interpret mean, median, mode, range, and quartiles while developing data-analysis skills.

Scroll to Top