-
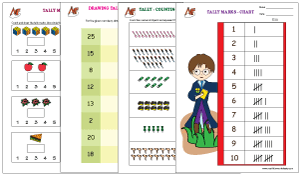
Tally Marks
 View All
Tally marks are a form of unary numeral system used for counting. Here are a lot of worksheets and activities to learn Tally. A frequency of data can be easily represented using Tally marks. Learn it all here.
-
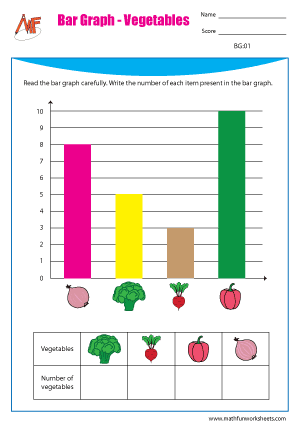
Bar Graph
 View All
A Bar Graph is defined as graphical display of data using rectangular bars. The bars can either be vertical or horizontal. Bar graphs with vertical bars are sometimes called vertical bar graphs.
-
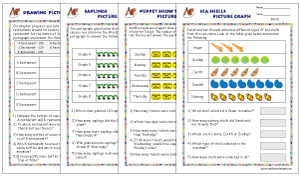
Pictograph
View AllPictograph is a method of graphical representation of data or information using figures or symbols. Each symbol used here denotes numbers. Large numbers are also represented using a pictograph. In such case, a key is given to a symbol which is used to represent large numbers. Pictogaphs can be drawn horizontally and vertically.
-
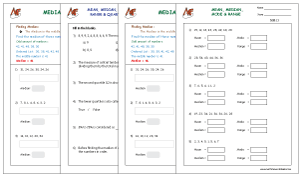
Measures of Central Tendency - Mean, Median, Mode and, Range
View AllMeasures of central tendency in statistics include mean, median, mode, range, and quartiles. Separate worksheets with detailed solved examples on each topic are given for practice. Concept based word problems are included.
-
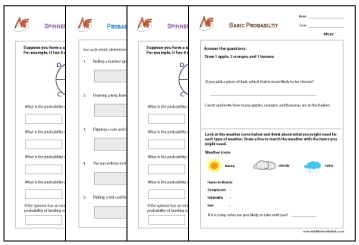
Probability Worksheets
 View All
These Probability Worksheets are designed to help students build a strong foundation in understanding and applying probability concepts through a variety of fun, hands-on activities. Suitable for upper elementary to middle school students.
Adobe Reader is required to download all the pdf files. If adobe reader is not installed in your computer, you may download it here for free: Adobe Reader Download.
Copyright © 2026. Math Fun Worksheets. All reserved!