In conclusion, mastering these charts at an early grade level equips students with the skills needed for higher-level math and real-world applications. They are simple, effective, and essential. So, if you’re in grade school and aiming for academic success, start using trigonometric charts today. With consistent practice, you’ll see a noticeable improvement in both your understanding and performance. Keep learning, keep practicing, and watch your grades rise.
Browse by Topics
- English Worksheets
- Science Worksheets
- Kid's Corner
- Numbers & Operations
- Addition
- Subtraction
- Multiplication
- Division
- Decimals
- Place Value
- Roman Numerals
- Skip Counting
- Odd & Even Numbers
- Patterns
- Cardinal & Ordinal Numbers
- Rounding Numbers
- Estimation of Numbers
- Estimation of Time & Money
- Counting & Cardinality
- Comparing Numbers
- Ordering Numbers
- Fractions
- Prime & Composite Numbers
- Squares & Cubes
- Square & Cube Root
- Divisibility Rules
- Factors & Multiples
- Data Handling
- Algebra
- Ratio
- Least Common Factor
- Greatest Common Factor
- Percent Worksheets
- Proportion
- Order of Operations
- Scientific Notation
- Exponents
- Algebraic Expressions
- Evaluating Algebraic Expressions
- Simplifying Algebraic Expressions
- Graphing Lines
- Point Slope Form
- Two Point Form
- Two Intercept Form
- Equations
- Identifying Functions
- Evaluating Functions
- Function Table
- Domain and Range
- Trigonometric Charts
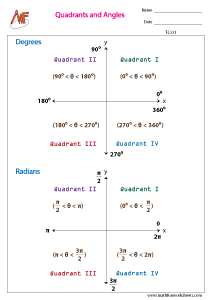
- Quadrants
- Polynomials
- Measurement
- Geometry
- Word Problems
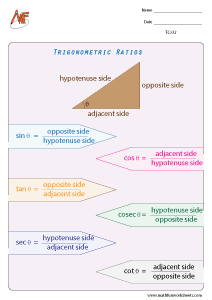
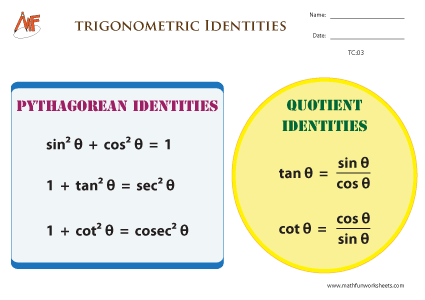
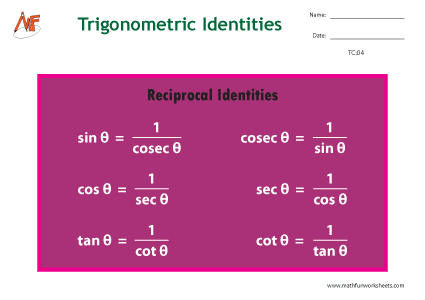
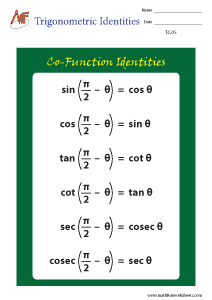
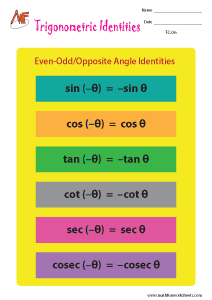
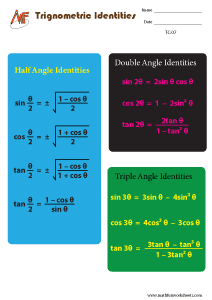
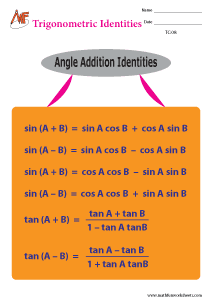
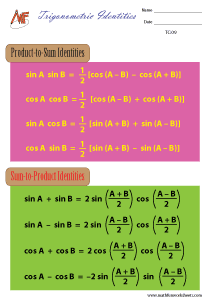
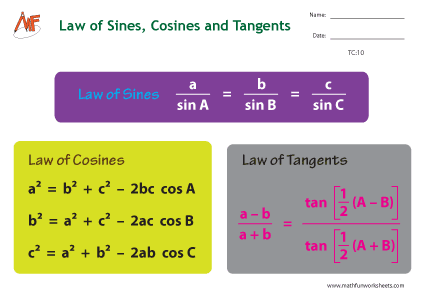
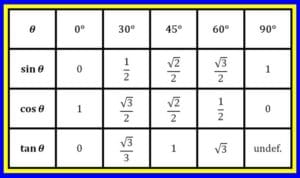
Trigonometric Charts
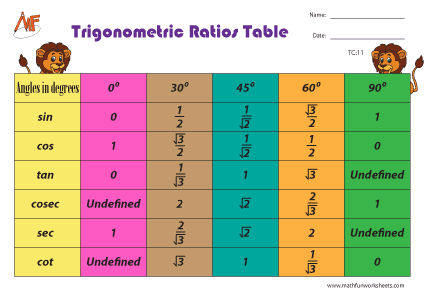
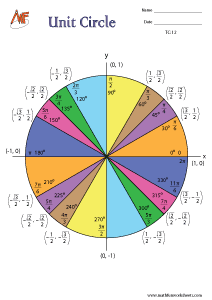
Trigonometric Charts play a vital role in mathematics, especially in the study of angles and measurements. These charts provide the values of trigonometric functions such as sine, cosine, and tangent for various angles. Typically, students begin using them around the middle school level, particularly in grade 9. They serve as a quick reference tool and help simplify complex calculations. As a result, students can save time and improve accuracy during problem-solving.
Understanding trigonometry is crucial in mathematics, physics, engineering, and various competitive exams. This webpage provides the standard values of trigonometric functions like sine (sin), cosine (cos), tangent (tan), and their reciprocals — cosecant (csc), secant (sec), and cotangent (cot) — for commonly used angles.
Moreover, these charts are not limited to academic use. Engineers, architects, and scientists use them in practical applications. For example, they aid in designing buildings, analyzing waves, and calculating distances. Therefore, learning how to read and apply these charts early in your education is highly beneficial. It builds a strong foundation for more advanced studies in trigonometry and related fields.
Related Worksheets: Trigonometric Ratio Worksheets
Download Free Trigonometric Charts
In addition to their practical use, these charts enhance learning by helping students recognize patterns and relationships between angles and ratios. This leads to better comprehension and improved grades. Students who practice regularly with these charts often gain confidence and perform better in exams. Besides, the charts are easy to memorize and use, which makes them a helpful tool during tests and assignments.