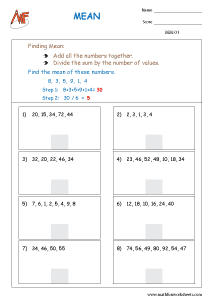
1.Mean
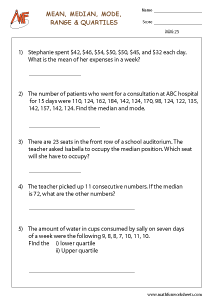
The average value of a set of numbers is called the mean.
Add all the numbers to get a total and then divide the total by the number of entries.
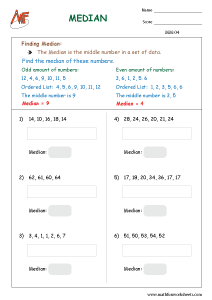
2. Median
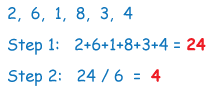
The middle number of a sorted data is called the median (ascending or descending data sample).
When the data sample has odd entries pick the middle value where half of the data lies below and above the middle value.
When the data sample has even amount of numbers, you have two median numbers. Here just add these numbers and divide them by 2.
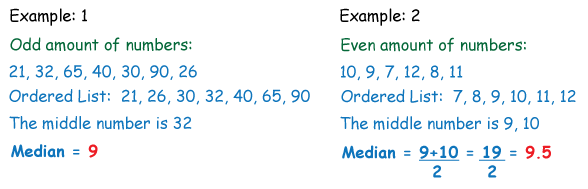
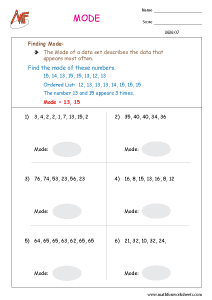
3. Mode
The data that appears more often in a data set is the mode. This measure can have more than one value for a set of data.
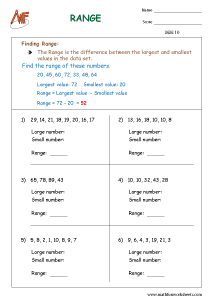
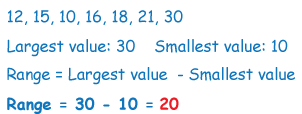
4. Range
The difference between the highest and lowest values in a data set is called the range.
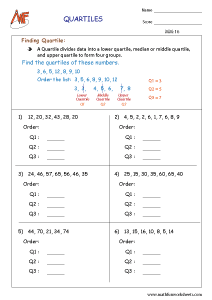
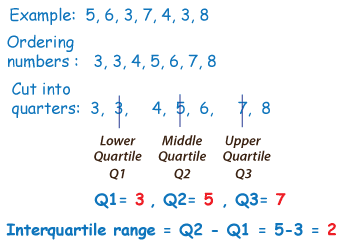
5.Quartiles
A quartile divides data into three points. They are lower quartile, median, and upper quartile to form four groups of the dataset. Lower quartile is also called as first quartile, second quartile as median and third quartile as upper quartile.
The distance between the first quartile and the second quartile is called the interquartile range.
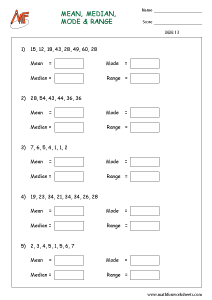
Find Mean, Median, Mode, Range

Find Mean, Median, Mode, Range
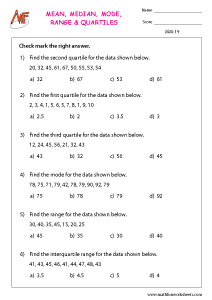
Check mark the right answer
Check mark the right answer
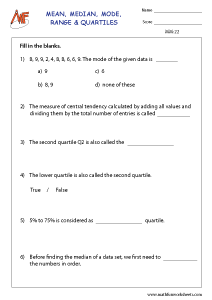
Fill in the blanks
Fill in the blanks