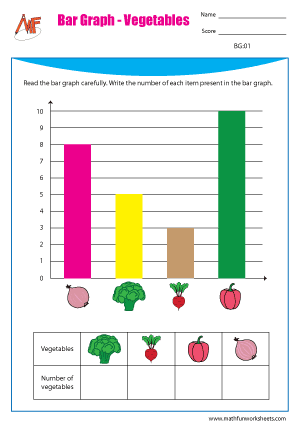
Reading Bar Graphs

Reading Bar Graphs
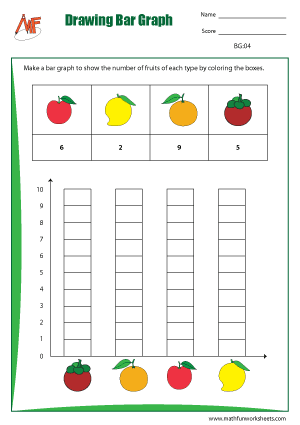
Drawing Bar Graphs
Drawing Bar Graphs
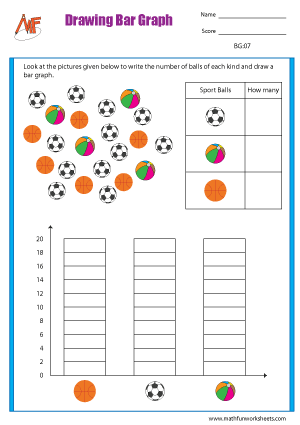
Count and Draw Bar Graphs
Count and Draw Bar Graphs
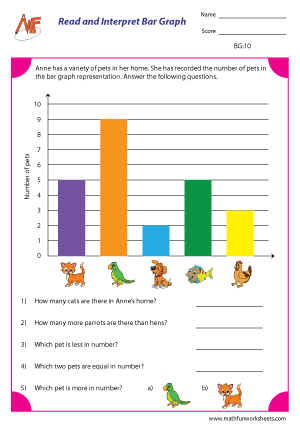
Read and Interpret Bar Graphs
Read and Interpret Bar Graphs
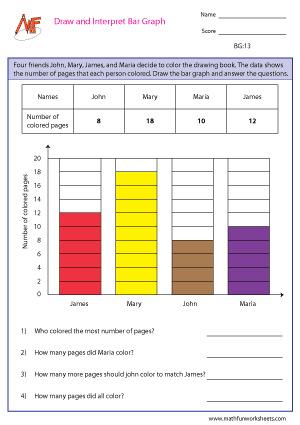
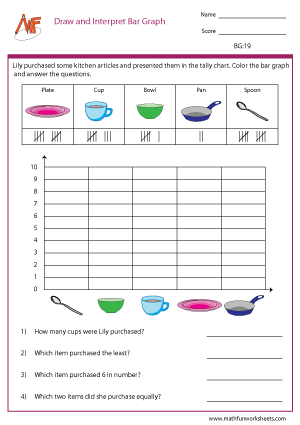
Draw and Interpret Bar Graphs
Draw and Interpret Bar Graphs
Bar Graphs and Tally Marks
Bar Graphs and Tally Marks
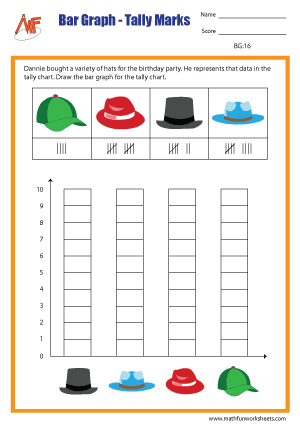
Draw and Interpret Bar Graphs with Tally Marks
Draw and Interpret Bar Graphs with Tally Marks
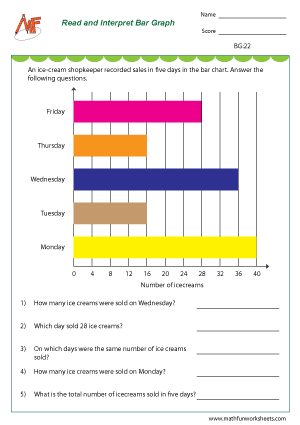
Read and Interpret Bar Graph
Read and Interpret Bar Graph
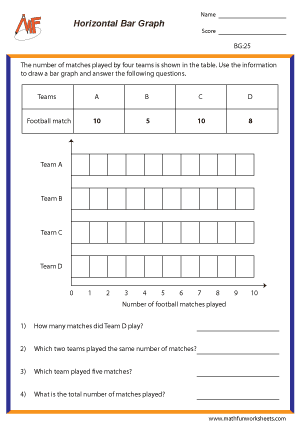
Horizontal Bar Graph
Horizontal Bar Graph
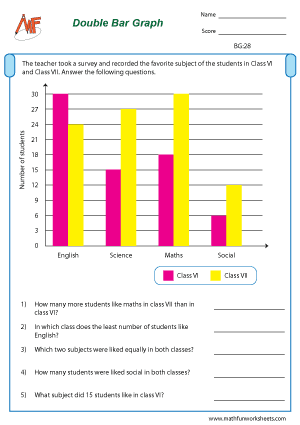
Double Bar Graph - Level 1
Double Bar Graph - Level 1
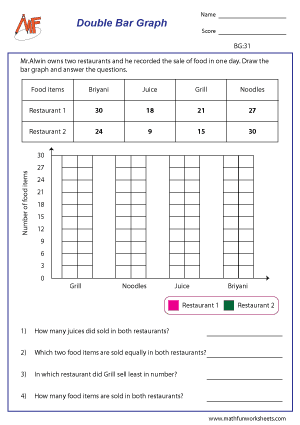
Double Bar Graph - Level 2
Double Bar Graph - Level 2