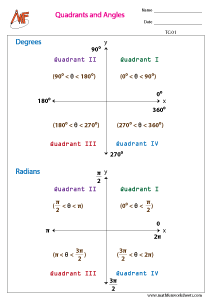
Trigonometric charts, also known as trigonometric graphs or plots, are powerful visual tools used in mathematics to represent the relationships between angles and the trigonometric functions sine, cosine, and tangent. These charts provide insights into periodic behaviors, oscillations, and waveforms, making them invaluable in various fields such as physics, engineering, and signal processing. Let’s delve into the world of trigonometric charts and explore their significance.
P stands for “perimeter,” l refers to the length of the rectangle, and w refers to the width of the rectangle
P stands for “perimeter,” l refers to the length of the rectangle, and w refers to the width of the rectangleX