Learn the interpretation of numerical data using Pictographs. Pictographs or picture graphs or simply pictogram is a method to represent data using pictures and symbols. A key is given in pictographs to describe what each picture stands for and also the numerical value assigned to it. Generally it answers the question ‘how many’.
https://www.mathfunworksheets.com/pictographs/
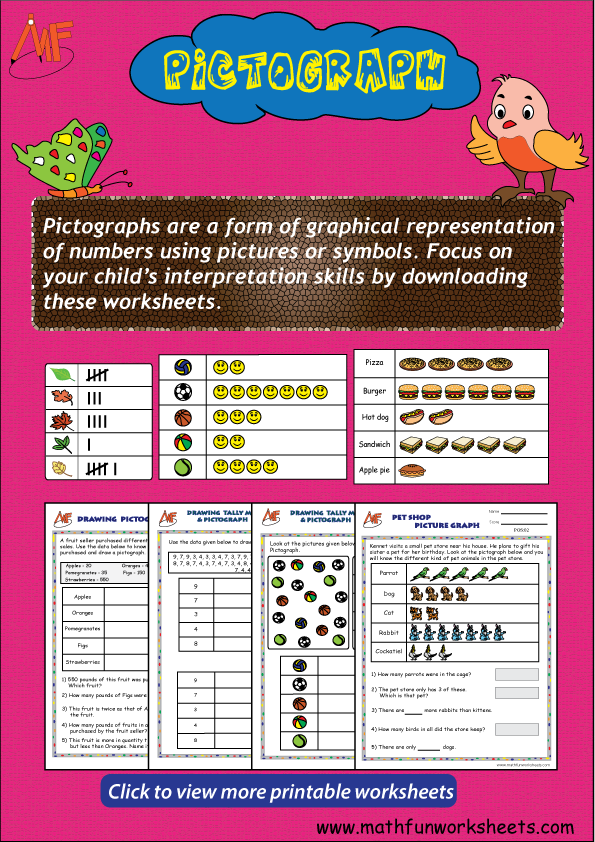
What is a Pictograph?
Pictograph or picture graph is graphical representation of numerical data using pictures and symbols. A key is given to a symbol which is used to represent large number (more data). Eg. If the key is 5, then a symbol is equal to 5.
What is key in a Pictograph?
The key given in a pictograph represents the numerical value given to a symbol. Eg. You have 20 flowers. When entries are more the graphical representation takes more space. Instead of using 20 pictures, if the key given is 5, only 4 pictures can be used. Hence larger numbers can be easily represented.
Why do we use picture graphs?
Data can be easily understood and interpreted when it is represented in pictorial form. In a pictograph, pictures are used to denote numbers. A pictograph can be drawn both horizontally and vetically. Generally we draw them horizontally
How do you represent information using a picture graph?
- The first step is to collect the data. Example:
Collect this data from your class. Ask for their favorite colors. Lets consider 5 colors. Red, Blue, Green, Yellow and Orange.
- Make a small table to record this information
| Color Choice | Number of students |
| Red | 8 |
| Blue | 6 |
| Green | 4 |
| Yellow | 12 |
| Orange | 10 |
- With the above information, you can easily make a pictograph. Consider the key as 2. Select a simple picture for the pictograph.
- Key: 1 © = 2 students
| Color Choice | Number os students |
| Red | ©©©© |
| Blue | ©©© |
| Green | ©© |
| Yellow | ©©©©©© |
| Orange | ©©©©© |
- By now, kids would have understood the total number of students who were surveyed and their choices.
Here we have prepared worksheets according to the Common core Standards. Worksheets can be used from grade 1 through grade 6. Each worksheet carries a theme. The first 3 worksheets are for beginners, without key. The next 9 worksheets are practice pages to read and interpret a pictograph. It is divided according to the key, which is upto 5, upto 10 and upto 20. The further 6 worksheets are to draw, read and interpret data. This can be challenging for kids. In the last 9 worksheets, the first two sets are to make Tally charts and pictographs and the rest are mathing activity.
For more Tally graph worksheets, click on the link given below.
https://www.mathfunworksheets.com/tally-marks/
Download them all and practice to sharpen your interpretational skills.
Comments are closed.